Field Note: The Human Cost of Interoperability (and the Legal Cost of Speed)
Scene
It’s 11:30 AM. The brief is tomorrow morning. The overlap window is midday, because that’s when everyone can attend. The cost is not overtime. The cost is prime mission hours.
They are sitting in a Teams call, waiting on the next office in the chain.
The next office is not late because they are sloppy. They are late because they just finished their own internal pre-brief. One more manual verification cycle. One more spreadsheet reconciliation. One more “let’s make sure the numbers match before we walk into the synchronization meeting.”
This is the hidden human cost of interoperability dysfunction. It punishes your best people on both ends of the spectrum.
It punishes the office that invested in maturity because their tempo gets throttled by the slowest interface. It punishes the office that is still manual because they have to sprint just to be allowed into the room.
Everyone pays. Every week.
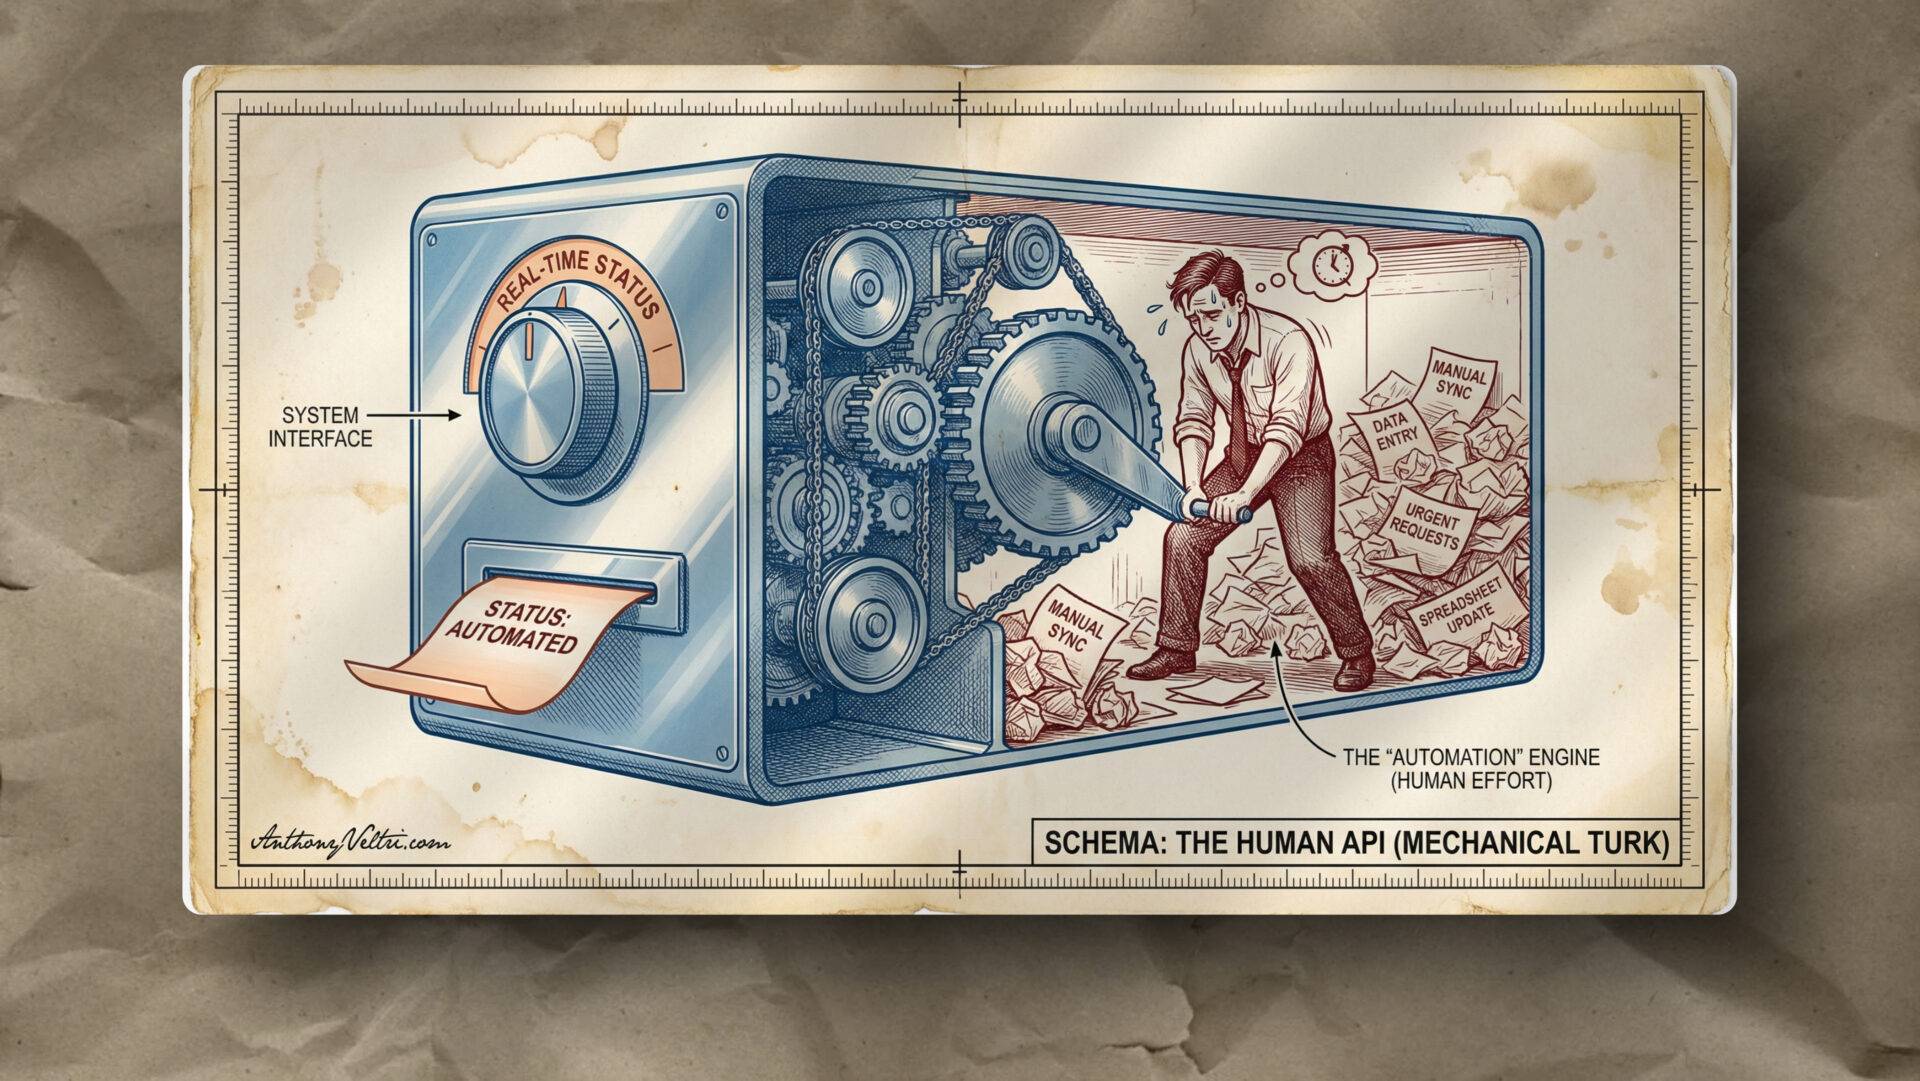
Bridge
The meeting is not late. The system is late. The system forces human beings to become the synchronization layer. Interoperability is being paid for in meetings instead of in architecture.
Break
Break: The Dashboard Word Problem
A core problem in federal conversations is that the word dashboard is overloaded.
To many teams, a dashboard is a reporting surface. It is a place to consolidate information after human beings have already done the hard work of harmonization in meetings. The dashboard is where the results are displayed.
To leaders and portfolio owners, a dashboard is supposed to be a strategy instrument. It should surface what matters, reveal cross-cutting patterns, and support decisions. It should reduce coordination drag, not just visualize it.
Both uses are valid. But when people argue about dashboards, they are often arguing about different jobs.
Compass-X is something our team designed and implemented to serve both jobs, but it is optimized for the second.
It is not a scrapbook for reporting. It is a portfolio layer designed to make information decision-ready.
Break: The Boundary Is the Failure Plane
This is the part people misread as “bad coordination” or “someone is failing.” Often it is neither. It is a loosely coupled outcome.
No memo is required for the whole enterprise to drift into the same weekly ritual. Shared incentives and shared ambiguity coordinate behavior through the environment. (See: Field Note: Loosely Coupled Power Grabs.)
Many offices succeed at dashboards. They build something real. They build something useful. Sometimes they even build automation that makes internal reporting dramatically easier.
So why does it stop there? Right there at their local silo or chain of command?
Because local dashboard efforts typically optimize for local truth, not cross-office schema and governance.
This is not a criticism. It is a rational survival strategy.
Local teams build what they can control. They define their fields their way. They build measures that match their leadership questions. They succeed inside their perimeter.
But the moment that information has to cross into a coordination briefing, it hits boundary conditions:
- Different definitions for the same labels
- Different maturity levels
- Different SharePoint usage patterns
- Different cadences
- Different permissions models
- Different incentives
- Different governance, or no governance at all
The dashboard did not fail because the builder lacked skill. It failed because it was never designed to carry meaning across boundaries.
Break: Celebrate the Local Builder, Do Not Mythologize Them
We often call the person who builds local automation a “guru” or “wizard.” That language creates distance. It turns competence into magic. It implies the work cannot be replicated.
A better framing is: local builder, portfolio improver, office-level optimizer.
This person is not hoarding magic. They are doing what mission-driven people do when the system cannot keep up with operational tempo: they build a workaround that reduces friction for their team.
They should be celebrated.
They also become a predictable failure point when the organization treats a local win as an enterprise solution.
Why? Because it is usually other duties as assigned.
Federal offices are not overstaffed. Local builders are rarely sitting idle waiting for more work. They are already doing mission work, and this optimization is layered on top.
That creates a local optimum that is real, useful, and fragile.
Fragile does not mean bad. It means it cannot be the foundation for enterprise coordination.
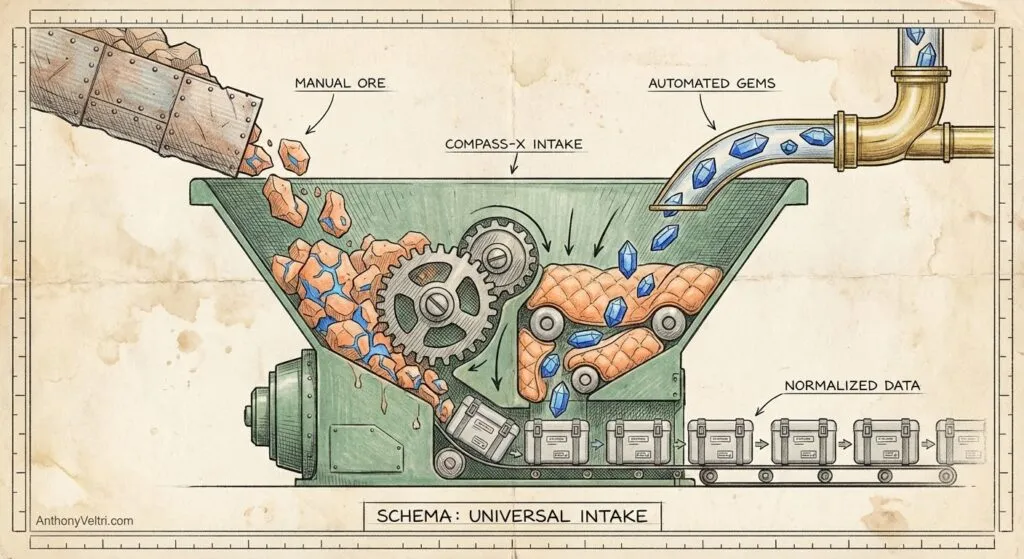
Break: Ore, Gemstones, and Synchronous Blocking
We need language that respects the manual offices.
The manual office is not bringing junk.
They are bringing ore.
Inside that heavy, messy, labor-intensive material is the same truth that the mature office can produce as a polished gemstone.
The difference is not the value of the truth. The difference is the weight of the process required to extract and validate it.
The mature office can produce polished truth quickly.
The manual office produces truth through labor: verification calls, line-by-line review, and repetition.
When the department demands synchronized reporting at high tempo, the mature office and the manual office collide.
The mature office is ready.
The manual office is still carrying the weight.
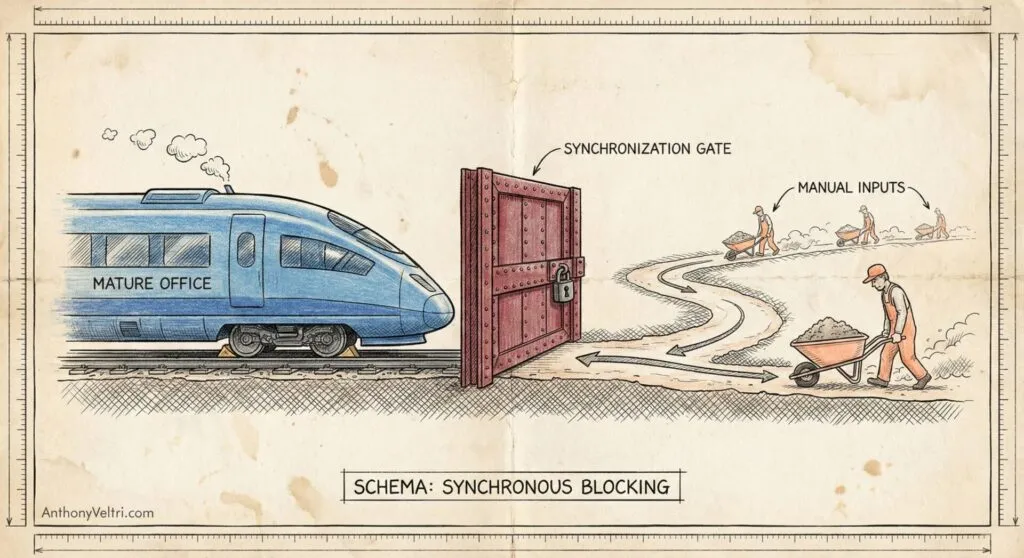
Then comes the worst part: synchronous blocking.
The mature office cannot move forward until the manual office arrives, because the portfolio rollup depends on everyone.
This is not a moral failure. This is an architectural failure.
Break: Tempo Mismatch Without Insult
People sometimes reach for harsh metaphors to explain this. They compare a sports car to a tractor. That is not necessary and it can be insulting.
A better analogy is different tractors.
One office has a modern tractor with GPS guidance, efficient implements, and clean maintenance schedules. Another office has an older tractor that still works but requires more manual effort and more care to produce the same output.
Both are doing real work.
But if the organization forces them to operate as one synchronized unit without a harmonization layer, the tempo of the entire system becomes the tempo of the hardest interface.
This is why local dashboards do not scale.
They increase local speed, but they do not reduce boundary friction.
Break: The Real Realization
The failure is not competence. It is not effort. It is not tooling.
It is boundary friction caused by missing shared meaning.
The department does not have an interoperability container.
Mechanism Note: Coordination Without Conspiracy
If this problem is widespread, do not require a central mastermind to explain it. Many offices independently choose the same coping behaviors because the environment rewards the same moves. That is loose coupling. It produces enterprise outcomes without enterprise design. (See: Field Note: Loosely Coupled Power Grabs.)
Field Note: Loosely Coupled Power Grabs
Schema
Schema: Federation, Not Integration
The strategic mistake agencies make is applying integration thinking to a federation problem.
Integration works when you control every component. But in interagency coordination and cross-office portfolios, you don’t.
Federation accepts that the components are autonomous, and still produces a coherent rollup by standardizing meaning, not uniforms.
Compass-X uses a federation architecture. It creates a permissions boundary where a manual Excel sheet and an automated system can coexist without forcing the manual office to upgrade overnight.
We don’t harmonize the people in a meeting.
We federate the data in the architecture.
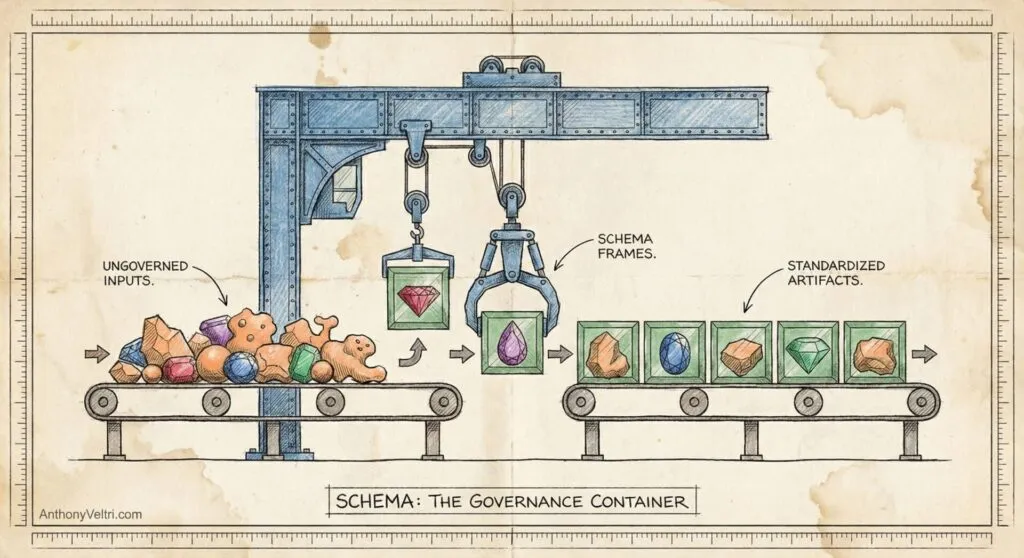
Schema: The Governance Container
This is the core distinction.
Local dashboards manage information.
Enterprise portfolio visibility requires shared meaning.
That shared meaning is schema and governance.
Schema is not a buzzword. It is the definition of what the organization means when it says:
- On track
- At risk
- Blocked
- Progress
- Risk score
- Dependency
- Milestone complete
- Escalation required
These are not labels. They are operational commitments with consequences.
Governance is how those definitions are maintained and defended over time:
- Who owns the definitions
- Who can change them
- How changes are versioned
- How disagreements are resolved
- How provenance is preserved
- How exceptions are handled without breaking the whole system
Local builders do not usually have the political authority to define schema for the entire department. Nor should they.
So the work stays local.
Compass-X exists to provide this missing layer: a portfolio-level schema and governance frame that lets different offices contribute without forcing them to become identical.
It accepts ore.
It accepts gemstones.
It makes both usable in the same rollup without relying on a weekly meeting to do the translation.
Schema: The Semantic Model Mirage (The Scoreboard Trap)
This is where many government organizations get stuck.
They build a semantic model and assume the governance problem is solved.
They assume:
“We have a dataset, relationships, and measures. Therefore the definitions are settled.”
This is the trap.
A semantic model can be internally consistent while the organization is still internally incompatible.
A semantic model can compute perfectly against inputs that are not comparable across offices.
That creates the illusion of coherence.
Semantic model (scoreboard)
A semantic model is the scoreboard.
- Tables and relationships
- Measures and calculations
- Filters and row-level security
- Performance at scale
Schema and governance (rules and refs)
Schema and governance are the rules of the game.
- Definitions and status taxonomy
- Required fields and data contracts
- Ownership and change control
- Provenance and audit trail
- How exceptions are handled without breaking comparability
You can build a beautiful scoreboard while teams are still playing different sports.
Schema: Strategic Alignment Is a First-Class View, Not a Side Quest
When alignment is not visible, every brief becomes a bespoke translation exercise.
- If alignment is not visible, leadership asks for more slides.
- Slides create more pre-brief work.
- More pre-brief work increases decision latency.
- Compass-X makes alignment visible because the schema makes rollups comparable.
The federal failure mode
A semantic model gets built in one pocket of the organization and works locally. Leaders see a polished report and assume the department is aligned.
What they are actually seeing is one office’s rule set projected at scale.
That is why you get the predictable moment in a coordination meeting:
“Why do these numbers not match what our office reports?”
The answer is rarely that the math is wrong.
The answer is that the rules were never agreed:
- What is a project vs an activity?
- What counts as percent complete?
- What does “at risk” mean?
- What is the time window?
- Who is authorized to set or change a status?
- What is the source of truth for each field?
A semantic model can make numbers add up.
Schema makes the numbers mean the same thing across the department.
What Compass-X does differently
Compass-X does not sell a better scoreboard.
Compass-X installs the rules and the enforcement mechanisms that make the scoreboard meaningful across offices.
Then we implement those rules in the semantic model and workflow so:
- Rollups are comparable
- Exceptions are visible
- Provenance is preserved
- Portfolio decisions can be defended
This is the difference between “we have dashboards” and “we have portfolio coherence.”
Schema: The UI Iceberg (The “Just Add a Column” Trap)
Leadership looks at a dashboard and sees an interface.
They ask: “Can we just add a column for interagency risk?” or “Can we just show dependencies by mission area?”
They think it is a small UI change.
It is often not.
Under the surface, a local builder knows the truth: there is no pipe for that data. There is no consistent schema. There is no governance. The moment that column becomes mandatory, a new manual collection ritual is born, and the pre-brief grows.
Most “just add a column” requests are not UI work. They are schema work.
The safe way to evolve schema is to separate stability from experimentation.
Two-Lane Architecture
Execution lane: where projects live, changes are vetted, and stability is king.
Innovation lane: where portfolio views, alignment experiments, and rollup rules can evolve safely.
Most dashboard attempts fail because they try to do innovation work inside the execution lane.
By separating the lanes, you can evolve the strategy layer without disrupting the mission layer.
Compass-X makes “just add a column” safer because it installs the piping below the floorboards: the schema, the provenance, and the harmonization mechanics that prevent UI requests from becoming new spreadsheet burdens.
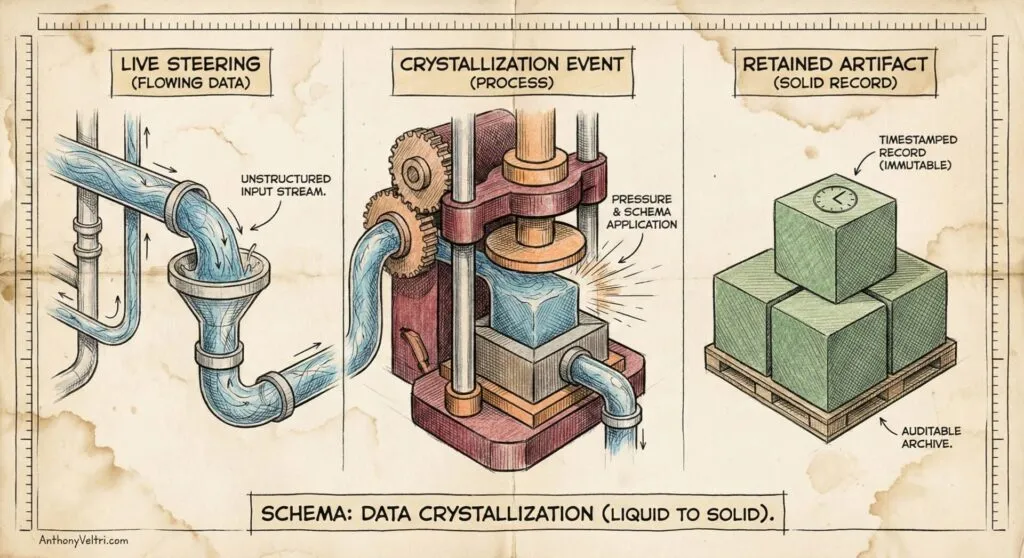
Schema: Live Steering vs Crystallized Retained Artifact (The Legal Cost of Speed)
Now we get to the part that matters to General Counsel, records officers, auditors, and FOIA teams.
A dashboard is a live view. It is a navigational instrument. It changes as data changes. It is excellent for steering.
But a changing view is not a record of what was true at decision time.
A portfolio decision made from a live dashboard still needs a defensible artifact: a crystallized, timestamped snapshot retained in the approved repository.
Otherwise, the organization is moving fast without leaving a trail.
Compass-X is designed to produce both:
- The live dashboard for decision-making
- The snapshot artifact for retention, traceability, and defensibility
- Provenance links that tie the artifact back to source systems and owners
This is not bureaucracy for its own sake.
It is how you move faster without increasing legal exposure.
Schema: The Permission Boundary
How do we fix synchronous blocking without firing everyone and buying a new ERP system?
We stop trying to integrate everything and start federating with intent.
Federation creates a permission boundary where different tools and maturity levels can contribute without forcing uniformity.
The meeting stops being the harmonization engine.
The architecture becomes the harmonization engine.
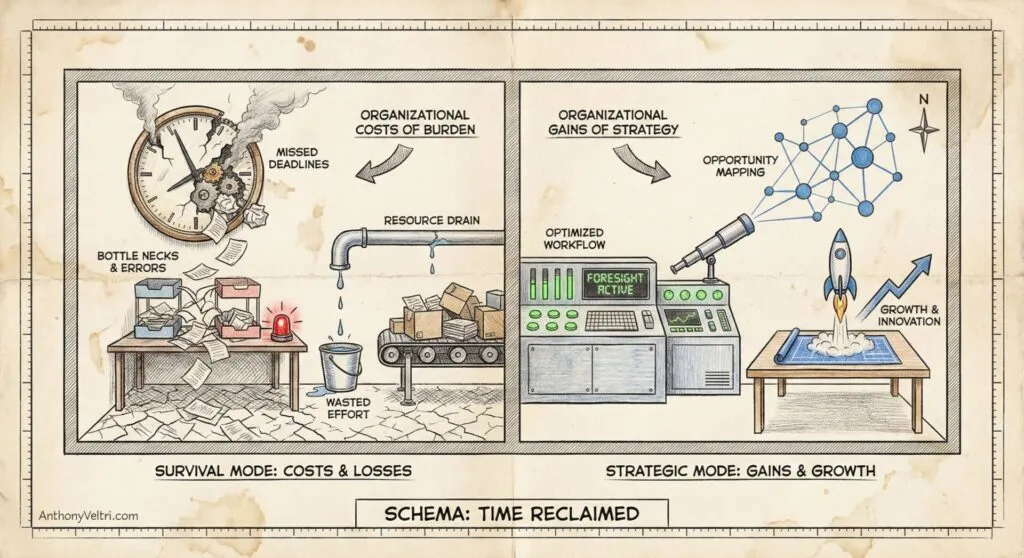
Schema: From Survival to Strategy (Application)
Right now, many federal teams spend most of their energy in survival mode.
They spend their time preparing weekly rollups, verifying numbers, reconciling mismatched definitions, and producing briefing materials.
That leaves little capacity for strategy.
Compass-X changes the allocation of effort:
- Less time spent hauling weight into pre-brief meetings
- More time spent interpreting patterns across the portfolio
- Less dependence on local heroes
- More durable coherence across offices with uneven maturity
- Faster decisions with better traceability
You still get the vertical report for leadership.
You also get the horizontal strategy for the portfolio.
And you get it without burning out the people doing the work.
Appendix: Schema vs Semantic Model (in one page)
Schema
Schema is the shared contract of meaning and structure across the organization.
It answers:
- What fields exist
- What they mean
- What values are valid
- What is required vs optional
- What “status” means and how it is computed
- What must be true for rollups to be comparable across offices
Schema exists regardless of tooling. It is bigger than Power BI.
Semantic model
A semantic model is a Power BI or Fabric implementation artifact that uses tables, relationships, measures, and business logic to express meaning in a specific environment.
It answers:
- How data is related
- How measures are computed
- How filtering works
- How business logic is encoded
- How the BI layer presents meaning to end users
A semantic model can enforce parts of a schema, but it is not the whole schema, because schema also includes governance, input contracts, naming standards, and cross-office definition control.
In short:
- Schema is the rules of the game.
- Semantic model is the scoreboard implementation.
Field Test: Do We Have a Data Problem or a Schema Problem?
If you want to test whether this problem exists in your environment, ask one question in your next rollup:
“When we say at risk, do all offices mean the same thing, and do they compute it the same way?”
If the answer is “it depends,” you do not have a dashboard problem. You do not even have a data problem.
You have a schema and governance problem.
And here is the tell: if you have to schedule a meeting to translate what a status means, then human beings are still your integration layer.
Deep Dive: Three Follow-Up Questions That Reveal the Truth
- Definition: What does “at risk” mean here, in plain language?
- Computation: Who sets it, and what inputs change it?
- Auditability: If a decision is challenged later, can you reproduce what was true at decision time, and show provenance?
If any of those answers differ across offices, rollups are not comparable yet. The scoreboard can still look clean. The game is not standardized.
Last Updated on February 22, 2026