Data Modeling for Practitioners: Vocabulary Crosswalk from Field Experience to Architecture Terms #
Doctrine Claim: Whether you are troubleshooting a schema in a secure facility or defining strategic intent in a boardroom, you are governing the same system from different altitudes. The friction happens when those altitudes speak different languages.
This annex is your universal translator. It validates that the tactical work of the technician is the structural foundation of the architect, and it gives leaders the vocabulary to align their strategy with ground truth without getting lost in the weeds.
The Technician to Executive Data Vocabulary Crosswalk #
Many leaders rise through an organization by first doing the work hands-on. They work with shapefiles, schemas, JSON exports, SQL tables, directory structures, CAD layers, or specialized scientific datasets long before anyone teaches them the academic vocabulary of data modeling. They are fluent in the craft because they lived it. They just may not have had a reason to call what they were doing an ontology or a logical model.
On the other side, data scientists and architects often come in through an academic or formal career path. They know the official terms, but they do not always know how that vocabulary maps to how things are actually used in the field. Both paths are valid. Both have blind spots. When you combine them without a translation layer, you get federated confusion.
This annex provides a crosswalk so that senior leaders who came up through the technician ranks can align their lived experience with the formal vocabulary of the data science and architecture community. It also helps data specialists understand how their terms map onto the reality of operational systems. This crosswalk matters because clear language creates shared understanding. Shared understanding creates alignment. And alignment is what turns a group of specialists into an integrated team.
1. Why This Annex Exists #
If you work in complex technical or operational environments, you have probably sat in a meeting where someone says:
“Tell us about your approach to data, data modeling and how it relates to architecture, data catalogs, and ontologies.”
Many practitioners feel a spike of anxiety at that question. Not because they lack experience, but because:
- They have been doing the work for years
- They have not been using the formal vocabulary
If this particular example does not cause you to swallow hard, here are a few other examples where it is easy to fumble:
Example: Did they ask about “Interoperability Standards” when you were thinking about “API Connectors”?
Example: Did they ask about “Governance Frameworks” when you were thinking about “Who is allowed to edit the sheet”?
This annex exists to close that gap.
By the time you finish reading, you should be able to:
- Recognize where you already do conceptual, logical, and physical modeling
- Connect that work to architecture, data catalogs, and ontologies
- Explain your approach in language that satisfies a senior architecture or governance board
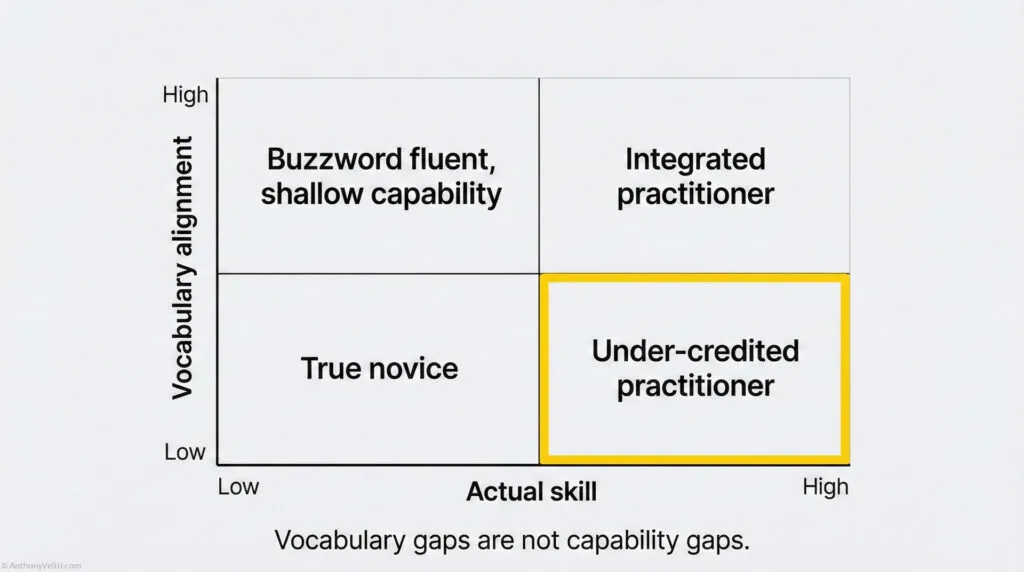
- Spot when a conversation is really about a vocabulary mismatch instead of a capability gap
2. You Are Probably Already Doing Data Modeling #
You do not need exotic tools to be “doing data modeling.” If you have ever:
- Designed the fields on a form
- Agreed on what “customer,” “incident,” or “asset” means across teams
- Structured a database, a spreadsheet, or a GIS layer
- Mapped a CSV into a different schema or API
You have done data modeling.
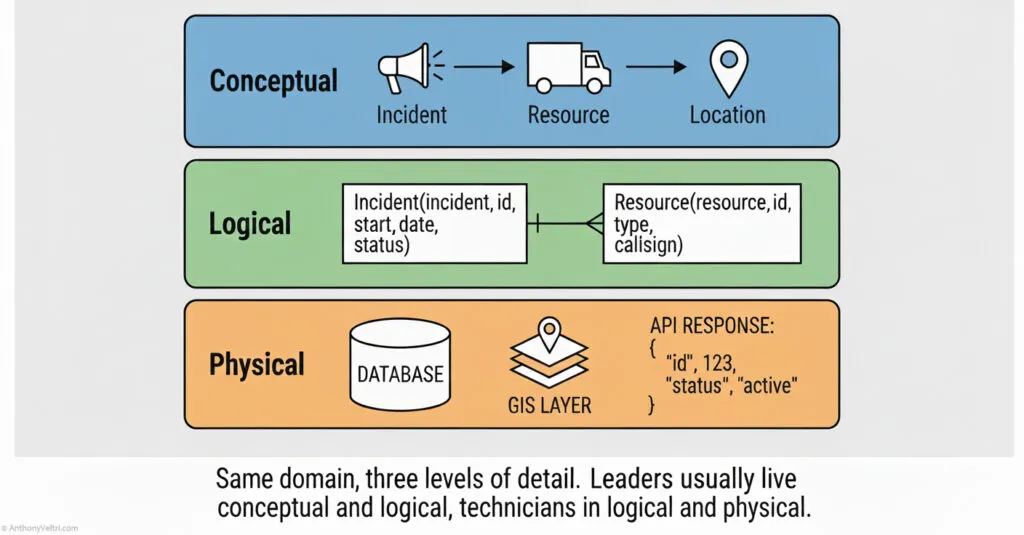
A simple way to see it is in three layers.
2.1 Conceptual Data Model #
Conceptual means: What are the important things in this domain and how do they relate at a high level.
Examples:
- In a wildfire system: Fire, Incident, Resource, Location, Forecast
- In a portfolio system: Project, Program, Portfolio, Outcome, Risk
- In a customer system: Customer, Order, Product, Invoice, Payment
This is usually where leaders and subject matter experts talk. You are naming the “nouns” and their basic relationships.
2.2 Logical Data Model #
Logical means: How do we structure those concepts so that systems can implement them.
Examples:
- Deciding that Incident has attributes like
incident_id,start_date,fuel_type,current_status - Agreeing that Customer has
customer_id,primary_email,billing_address,status - Choosing whether Resource is a single table with a “type” field, or separate tables for “aircraft,” “personnel,” and “equipment”
Logical modeling is where you stop arguing about English and start arguing about fields, types, and relationships.
2.3 Physical Data Model #
Physical means: How is this actually implemented in technology.
Examples:
- A PostgreSQL database with specific table names and indexes
- An Esri feature class with geometry and attribute schemas
- A JSON API where the response structure is
incident.resources[0].callsign - A WordPress database where custom fields and taxonomies map to your logical model
This is where database designers, middleware developers, and integrators live. It is “what actually gets deployed.”
Key point for leaders:
You do not have to build tables or write JSON to claim data modeling experience. If you shape the conceptual and logical layers, and guide the physical implementation, you are doing the work.
3. Architecture, Data Catalogs, And Ontologies #
The question that often triggers anxiety is some version of:
“How do you approach data modeling and how does that relate to architecture, data catalogs, and ontology?”
Here is the clean crosswalk.
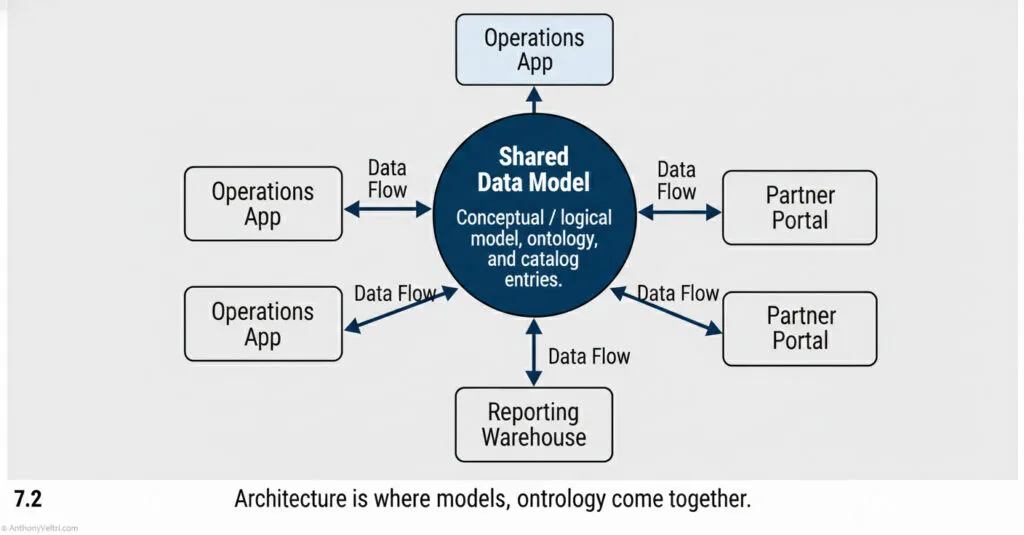
3.1 Architecture #
Architecture is the big picture.
It describes:
- What systems exist
- How they talk to each other
- Where data lives and flows
- Which layers are shared or isolated
- How change is governed
Data modeling sits inside architecture as the blueprint for “what the information actually looks like.”
3.2 Data Catalog #
A data catalog is the organized index of your data assets.
It typically:
- Lists datasets, tables, and APIs
- Describes what each field means
- Identifies owners and stewards
- Notes quality, lineage, and access constraints
Good data catalogs rest on clear conceptual and logical models. Without that, the catalog is just a prettier directory.
3.3 Ontology #
An ontology is a structured vocabulary for a domain.
It includes:
- Agreed terms and definitions
- Relationships between concepts
- Sometimes hierarchies or taxonomies
- Rules about how concepts relate
If a conceptual model says “Project relates to Outcome,” the ontology defines exactly what “Outcome” means and how it should be used.
Simple mental model:
- Ontology: the words and relationships
- Data model: the shapes those words take in data
- Architecture: the stage where all of that is wired together across systems
4. Federated Vocabulary Versus Integrated Vocabulary #
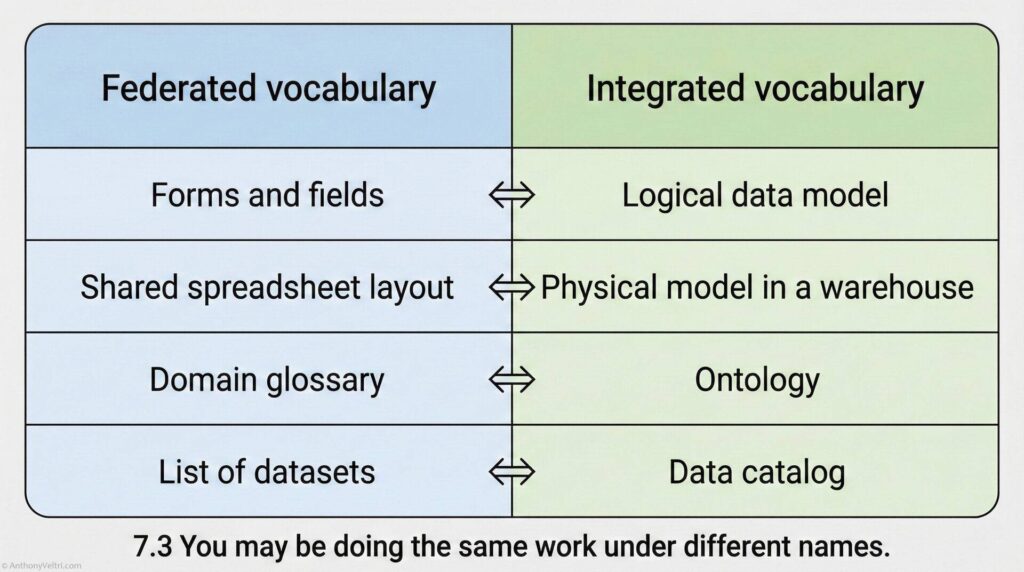
In real organizations, people use different dialects for the same work.
In federated systems like multi agency coalitions, research networks, or loosely coupled partners:
- People often do the work first and name it later
- Specialists talk about “forms,” “fields,” “layers,” “spreadsheets,” and “scripts”
- Agreements evolve organically, driven by operational need
In integrated systems like large enterprise platforms or multinational defense programs:
- Vocabulary is defined early and standardized across teams
- People talk about “ontologies,” “logical models,” and “data catalogs”
- Governance boards expect you to use those words precisely
The risk is simple:
You may be doing the thing but not naming the thing.
A few metaphors from other domains make this easier to see.
- In one community, people call it an immediate action drill
- In another, it is a malfunction clearance
- In another, it is an abnormal procedures checklist
- In another, it is a triage protocol
Different labels.
Same pattern.
Same purpose.
If no one maps the vocabulary, practitioners can:
- Underestimate their own experience
- Feel like impostors in front of formal boards
- Fail to recognize when they strongly overlap with “official” practices
This annex argues that many capable leaders already do data modeling, ontology work, and architectural thinking. They simply need a crosswalk vocabulary so that federated experience can be heard in integrated environments.
5. A Leader Friendly Answer Pattern For “Data Modeling” Questions #
Here is a pattern you can reuse when asked:
“How do you approach data modeling, and how does that relate to architecture, data catalogs, and ontologies?”
You can answer in four parts.
Part 1: Start With Your Principle #
“My approach is to keep conceptual, logical, and physical models aligned, so that architecture, data catalogs, and ontologies all tell the same story about the domain.”
Short, clear, pattern first.
Part 2: Describe The Three Layers In Your Own Work #
For example:
- Conceptual “First I align on the core concepts and relationships. For instance, what exactly do we mean by Incident, Resource, and Location, and how they relate. This is where subject matter experts and leaders participate.”
- Logical “Next I work with analysts and designers to turn those concepts into structured fields and relationships. We choose attributes, keys, and relationships that systems can use without losing the meaning.”
- Physical “Finally, I ensure that the physical implementations in databases, APIs, or GIS match that logical model, and that changes are governed so we do not break downstream consumers.”
Part 3: Connect To Architecture, Catalog, Ontology #
You can stitch that straight into:
“At the architecture level, those models tell us which systems own which data and how they integrate. The data catalog documents those assets so teams can find and trust them. The ontology keeps the vocabulary consistent, so when different nations or departments say ‘incident’ or ‘asset’ they mean the same thing.”
Part 4: Tie To A Concrete Example #
Close with a specific situation from your world:
“For example, when we brought 200 plus scientist built applications into an enterprise data warehouse, we used this structure. We started by clarifying concepts with the scientists, moved that into logical models that matched the warehouse schemas, and then mapped their physical database or flat file structures into the shared model. The catalog and ontology then made it possible for other teams to discover and reuse that data, instead of treating each app as a black box.”
“Another example: When we federated geospatial data across 100+ tribal, state, local, and federal partners for DHS infrastructure protection, we started by aligning on conceptual definitions (what does ‘critical asset’ mean? What’s the difference between ‘facility’ and ‘site’?) We moved those concepts into logical models that each partner could map their data to, then handled the physical integration through a shared service layer.”
This pattern is reusable in interviews, design reviews, and governance boards.
6. Practical Checklist: Are We Doing Data Modeling On Purpose #
Use this as a quick self-audit.
You are doing conceptual modeling if:
- Teams argue about what key terms mean
- You facilitate alignment on shared definitions
- You create diagrams that show entities and relationships in business language
You are doing logical modeling if:
- You decide what fields are required
- You design validation rules and relationships
- You simplify overlapping spreadsheets or schemas into one coherent structure
You are doing physical modeling if:
- You work with DBAs, integrators, or developers to implement structures
- You review table or API designs for alignment with business needs
- You think about indexing, performance, or storage layout, even at a high level
If you recognize yourself in these, you are engaged in data modeling whether you use the formal vocabulary or not.
7. Suggested Charts And Diagrams #
There were originally 4 diagrams in this section, Figs 7.1, 7.2, 7.3 and 7.4. I have distributed these visuals in the earlier sections where they are discussed. My original layout forces the reader to hold abstract concepts in their head until the very end so I had to fix that.
8. How To Use This Annex #
You can use this annex in three concrete ways.
- Self calibration
- Recognize where you are already doing data modeling
- Build confidence that your experience is legitimate, even if it emerged in a federated, low jargon environment
- Translation layer in interviews and boards
- When asked about “data modeling,” “ontology,” or “catalogs,” reuse the four part answer pattern
- Bring your real work into alignment with their vocabulary without pretending to be something you are not
- Coaching tool inside your organization
- Help scientists, engineers, and analysts see that their work fits into recognized disciplines
- Reduce friction between “doers” and “architects” by showing that they share concepts, even when the labels differ
The core message:
Many leaders and practitioners have been building and running data intensive systems for years without formal labels. Once you have a vocabulary crosswalk, you can stand in front of any architecture or governance board and speak with clarity, without discounting the value of where you learned your craft.
9: A Note on Federated confusion vs integrated brittleness #
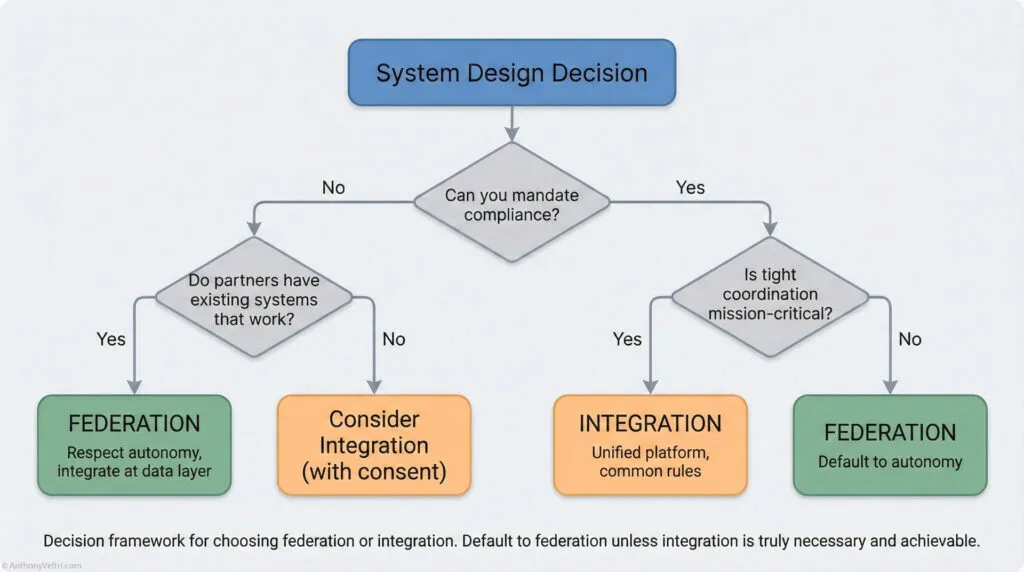
When people talk about “federated” vs “integrated” systems, they often treat “federated” like a magic word that will fix politics, complexity, and legacy constraints. In practice, both strategies have failure modes.
- If you federate badly, you get federated confusion.
- If you integrate badly, you get integrated brittleness.
Both are symptoms of the same root problem: no clear stewardship at the interfaces.
- In federated confusion, everyone keeps control of “their” system, but no one clearly owns the seams where systems meet. Vocabulary drifts, mappings are ad hoc, and nobody can say with confidence what the data actually means end to end.
- In integrated brittleness, you get the opposite failure. A single platform or model is treated as the one true way. Every change must pass through a tiny group of gatekeepers. Innovation at the edge slows or dies. When the central piece breaks, everything breaks.
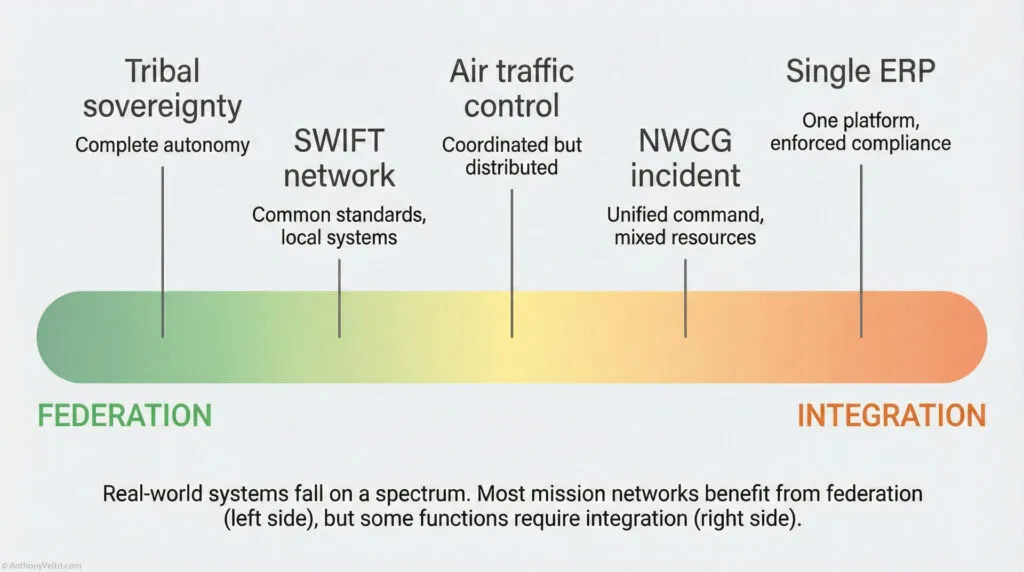
The goal is not to pick a side.
The goal is to know which risk you are trading for, when, and why, and to assign named stewards to keep the seams healthy.
Federated confusion vs integrated brittleness at a glance #
You can use this table as a quick diagnostic in design reviews, portfolio reviews, or after-action discussions.
| Dimension | Federated confusion | Integrated brittleness | Healthy pattern |
|---|---|---|---|
| Ownership | Everyone owns their local system. No one owns the interfaces. | A central platform team owns everything. Local teams feel like tenants. | Local teams own their systems. Named stewards own the interfaces and shared models. |
| Vocabulary | Multiple names for the same thing. Same name meaning different things in different systems. Mapping lives in one person’s head or in a forgotten script. | Single global model rigidly enforced. New concepts shoehorned into old fields. People work around the model in side spreadsheets. | Shared glossary and schema for what truly must be common. Local extensions are allowed and documented. |
| Change | Every partner changes on their own schedule. Interfaces drift quietly. Breakage shows up as “weird data” weeks later. | Any change requires a global negotiation. Backlogs grow. People stop asking for improvements. | Clear change process by altitude. Interface contracts versioned. Deprecation paths defined. |
| Failure modes | Failures are silent. Reports do not match. No one is sure whether the data is wrong or late. | Failures are loud and global. One central outage or model mistake blocks many teams. | Failures are contained. Federated systems can degrade gracefully. Interfaces have tests and monitoring. |
| Culture signal | “Everyone does their own thing. Integration is tomorrow’s problem.” | “Headquarters knows best. Local reality will adjust later.” | “Local autonomy with explicit federation guardrails. We argue about the interfaces on purpose.” |
| Common smells | Lots of ad hoc ETL scripts. Manual Excel bridges. Different definitions of “customer” or “incident” by team. | One “system of record” that nobody loves. Shadow systems bloom everywhere. People say “we cannot change that field, too risky.” | Intentional mix of integrated and federated domains. Regular schema reviews. Clear decisions on where convergence matters. |
| Leadership question | “Why does everyone have a different answer to the same question?” | “Why is a small change for one team so hard for the whole system?” | “Where do we truly need one way of working, and where is diversity of implementation acceptable?” |
How this ties to stewardship and ownership #
This pattern connects directly to your broader doctrine on stewardship and ownerless interfaces:
- Federated confusion is what happens when interfaces have no steward. People focus on their piece of the puzzle and assume “someone else” is handling the seams.
- Integrated brittleness is what happens when one steward claims everything and there is no room for local judgment or experiment.
Healthy systems have:
- Named stewards for major interfaces, vocabularies, and shared datasets.
- Visible ownership for each integration, not just for each system.
- Regular integration health checks where the question is “are the seams doing their job” instead of “whose system is better”.
You can use the phrases “federated confusion” and “integrated brittleness” in meetings as a shared shorthand:
“Right now our architecture smells like federated confusion. Everyone has a different definition of ‘incident’ and we do not know who owns the crosswalk.”
or
“We are drifting into integrated brittleness. Every small change requires global sign-off. Where can we loosen this to protect local agility without losing safety?”
That vocabulary gives people permission to talk about the tradeoffs explicitly, instead of hiding them behind buzzwords like “data lake”, “hub”, or “federated”.
10 – A Unifying Lens for Everyone #
Microsoft Fabric: When a “Data Lake” Is Really a Federation Layer #
A lot of practitioners first encounter Microsoft Fabric as “that new thing Power BI runs on” or “the place where OneLake lives.” It is easy to file Fabric away as just a data lake or just another Microsoft product name.
It is more useful to see Fabric as a data lake plus a federation layer plus shared governance, all wrapped around the idea that multiple tools should be able to work on the same data without endless copying.
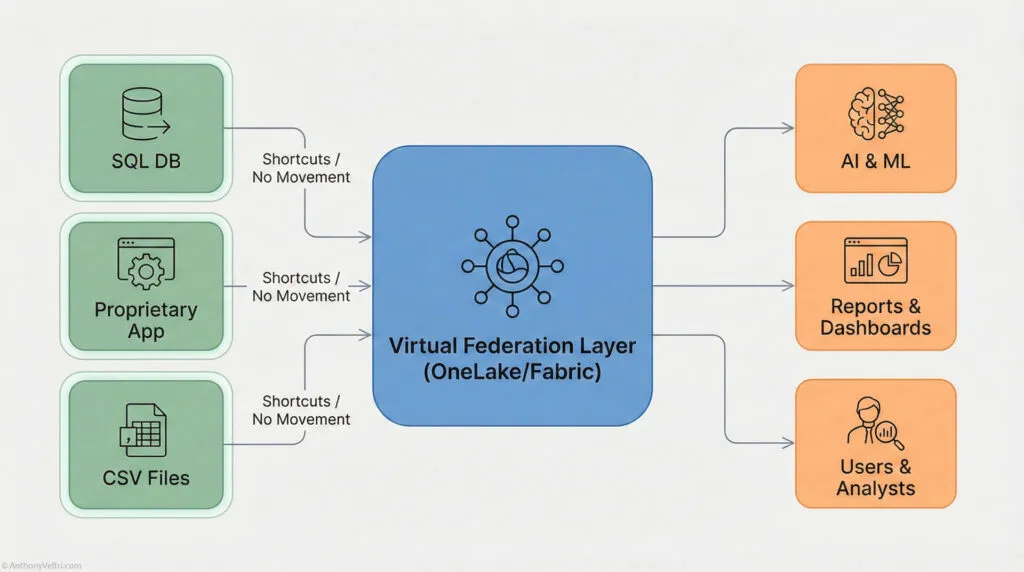
At minimum, Fabric gives you:
- OneLake as the centralized data lake
- Shortcuts and mirroring that let you point into other data stores without copying everything
- Pipelines and dataflows that shape and normalize data on the way in
- SQL, Spark, and Power BI all reading from the same storage layer
- Lineage and governance so you can see how the pieces connect
In other words, Fabric is not just the bucket that holds your data. It is also part of the seam layer that lets you federate across systems while still enforcing some shared structure.
If you already work with Fabric, you may be closer to a data-centric, federated architecture than you realize.
Technicians, Architects, Scientists: Three Altitudes, One Reality #
In many organizations, people are doing serious data modeling work long before anyone gives them the formal vocabulary for it. That is especially true for those who came up from the technician ranks into architecture or leadership.
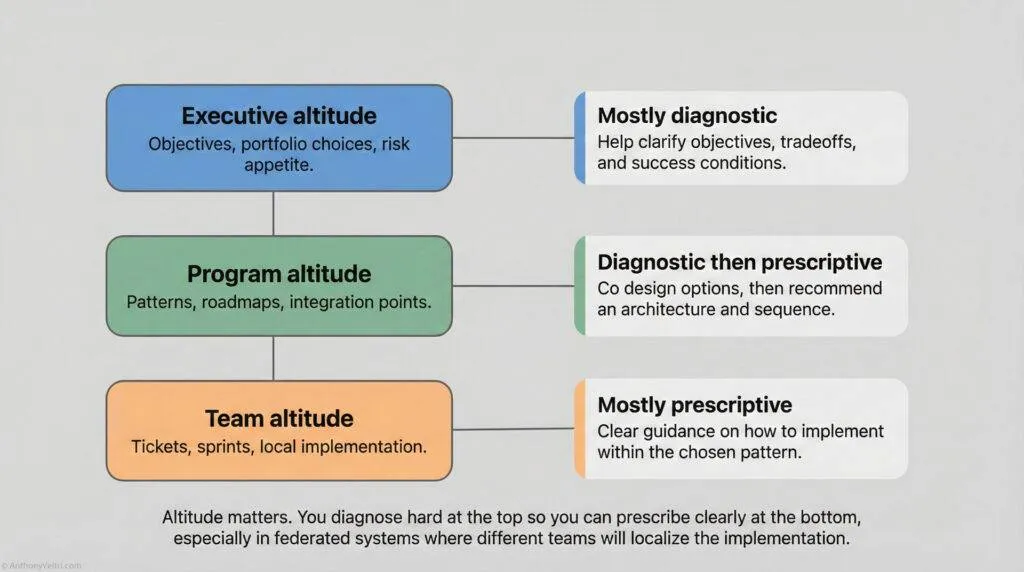
I find this framing helpful:
Technicians describe reality in the language of tasks.
Architects describe reality in the language of structure.
Scientists describe reality in the language of models.
They are all describing the same thing at different altitudes.
A few practical examples:
- A technician might say:
“I pull CBP events from this API every night, flatten the JSON, and push it into these three tables.” - An architect might say:
“We have an ingestion pipeline that normalizes heterogeneous event feeds into a common data model with a clear separation of raw, curated, and semantic layers.” - A data scientist might say:
“We treat CBP events as instances of a broaderOperationalEventontology with defined entities, attributes, and relationships that support both analytics and decision support.”
They are all pointing at the same reality.
They are just using the vocabulary of their altitude.
This is where vocabulary crosswalks matter:
- The technician’s “flatten the JSON” is the scientist’s “schema mapping” and the architect’s “ingest and normalization pattern.”
- The architect’s “semantic model” is the scientist’s “ontology” and the technician’s “the clean Power BI table that finally makes sense.”
- The scientist’s “entity relationship” is the technician’s “which IDs join to which IDs” and the architect’s “canonical model.”
If you do not make those equivalences explicit, you get federated confusion:
- Specialists think they are “just doing their job” and do not realize they are building an ontology.
- Architects talk about “data products” and “zones” while frontline staff only see more hoops to jump through.
- Data scientists talk about “ontologies and catalogs” and lose everyone who actually has to ship something by Friday.
The work is happening.
What is missing is the crosswalk between vocabularies and altitudes.
How Fabric Exposes the Vocabulary Gap #
Microsoft Fabric is a useful reference point because it bakes many of these ideas into the product, even if your teams never say “ontology” out loud.
Look at a simple Fabric scenario and you will see all three altitudes at once:
- Technician view
“I created a pipeline that lands sensor data in OneLake, then a dataflow that cleans it up for Power BI.” - Architect view
“We ingest raw events into a landing zone, standardize them into a curated layer, then expose a semantic model for analytics through shared datasets.” - Scientist view
“We defined an event ontology and mapped multiple source schemas into that model, then published the curated features in a central catalog.”
Fabric forces you to confront a few truths:
- OneLake is your data lake floor, even if you never call it that.
- Shortcuts and mirroring give you a federation mechanism that lets you bring other stores into view without dismantling them.
- The semantic layer in Power BI is, in practice, a data model that needs vocabulary discipline, not just pretty visuals.
If you never name those roles and concepts, you will still ship something.
You will just do it with more friction, more miscommunication, and more fragile handoffs.
If you do name them and crosswalk them, you get:
- Technicians who understand why those schemas and naming conventions matter
- Architects who can explain their diagrams in task language
- Data scientists who can anchor their models in the lived reality of operations
That is the real purpose of this annex:
Not to turn everyone into a data theorist, but to give leaders, architects, and technicians a shared vocabulary for the work they are already doing, especially when platforms like Fabric are quietly pushing them toward data-centric federation whether they are ready or not.
Field notes and examples #
- Field Note: When Everyone Uses the Same Words But Means Different Things: Why Integration Fails When Vocabulary Collapses
- Reclaiming the Right to Orchestrate: Decision Altitudes and Why Your Chisel Doesn’t Give You the Right to Judge My Output
- Golden Datasets: The Tracks Everyone Trusts
- Architect as Translator: Earplugs in the off-site Data Hall, Briefing at HQ in DC
- When You Become The Interface: A System “Tell” In Disguise
Last Updated on January 14, 2026